Overview
The surging middle-class in Latin America, Eastern Europe, Africa, and Asia continues to garner the attention of entertainment and media firms, like Winnie-the-Pooh on a food excursion. But, hungry upstarts equipped with state-of-the-art technologies and bagsful of money also spy the foreign honey pot and notice the scrumptious domestic one too. Not willing to share, Mickey countered with last year’s acquisition of video streamer BAMtech and pending takeover of media giant 21st Century Fox (“Fox”). This paper examines the impact of the recently announced reorganization on the valuation of The Walt Disney Company (“Disney”).
Specifically, an intrinsic valuation using a discounted cash flow approach determines the fundamental drivers of value. A competitive analysis of the entertainment and media space provides an overview of the environmental challenges facing Disney. Given Disney’s history, an analysis of corporate governance tries to identify any potential agency and other conflicts of interest issues. An inspection of Disney’s shareholder composition ascertains the likely marginal investor, useful in gauging affirmation of the company’s latest shake-up and any prospective changes to dividend and buyback policy. Also, the shareholdings of internet firms presently storming the Magic Kingdom are scrutinized for possible displacement in Disney’s shareholder register by growth-oriented punters. Digging into the corporate strategies, financials, and investing, financing, and dividend policies, the critical factors of value are identified to calculate the value of Disney’s reorganization.
Competitive Analysis
Impact of Innovation
New innovations dramatically alter the competitive landscape in the entertainment and media industry. In 2017 over 163 million computer tablets and 1.5 billion smart phones were sold globally giving consumers 24/7 content streaming capability. Big data, data analytics, machine learning, and artificial intelligence enable the deep analysis of consumer trends to curate personalized content and advertising and to feed other parts of the entertainment and media ecosystem with invaluable information. And blockchain payment systems could revolutionalize the merchandising and retail field. This cannot be underestimated as the data and processes that companies such as Facebook, Amazon, Apple, Netflix, Google, Baidu, and Tencent are constructing will act as raw material for, not just entertainment and media, but businesses across all sectors and beyond. Cloud storage and high-speed wireless communications extends the global reach of content providers. AR/VR transforms video gaming play and is finding its way to enliven events and enthrall fans. And improved CGI software continues to mesmerize audiences and their ability to discern real from virtual. Advancement in technology now stands ready to realize the true synergy in combining content and distribution.
Competitor Activity
AOL’s $164 billion takeover of Time Warner in 2000, arguably, stands as the most infamous media deal of all-time. Cable network and telecommunications providers, such as Comcast, Verizon, AT&T, and Altice, started encroaching into the entertainment and media space shortly thereafter, including, of course, the former’s failed $66 billion bid (including debt) for Disney in 2004. Verizon finally pulled the trigger in a succession of deals: $4.4 billion takeover of AOL in 2015, and $4.83 billion and $4.48 billion acquisitions of much of Yahoo’s internet assets in 2016 and 2017, respectively. AT&T acted in 2015 with the $48.5 billion acquisition of DirecTV and in 2016 with a $108.7 billion offer for Time Warner, which the latter continues to be held up by DOJ on anti-trust grounds.
However, the entrance of nimble, growth-driven, well-financed, tech-savvy giants Facebook, Amazon, Apple, Netflix, and Google, with ample experience in streaming videos and music and storing, organizing, and sifting through and monetizing via advertising and/or subscriptions terabytes of consumer data, pose a completely new level of threat. Furthermore, many of these internet and technology giants generate a sizable amount of their earnings overseas and thus are sitting on huge amounts of cash and marketable investments – over $250 billion in Apple’s case. The new 2018 tax law changes lowered the tax on repatriated earnings from 35% to 15.5% and 8%, for liquid assets and non-liquid assets, respectively. Regardless of classification, a tsunami of capital has already started makings its way back to U.S. shores, some of which will be earmarked for investments (e.g. acquisitions). No doubt, Disney is being closely monitored.
Disney’s Strategic Response
To better face the new challenges, in mid-March Disney restructured into four business segments: Direct-to-Consumer and International; Parks, Experiences, and Consumer Products; Media Networks; and Studio Entertainment. The newly created Direct-to-Consumer group contains the digital streaming business, including the recently launched ESPN+ service, Disney digital streaming, video streamer BAMtech, and partially-owned Hulu streaming service. A perennial producer of hit films and TV shows, albeit narrowly focused to appeal to the child in everyone, Disney has grown its brand portfolio to incorporate Pixar Animation, Marvel Studios, Lucasfilm, and Maker Studios, to go along with Disney Animation and Disney Pictures. In late 2017 Disney announced the $52.4 billion merger with 21st Century Fox for Fox’s high-profile entertainment assets (but excludes Fox’s television, broadcasting, news, and sports and Sky Sports F1 racing channel) further broadening Disney’s fan base and reach into the UK, Europe, and Asia; also, included is an additional 30% stake (for a total of 60%) in Hulu, a digital streamer of TV programs targeting 18-49 year olds. By combining its theme parks, interactive, and consumer product lines Disney plans to deliver an immersive experience (including live VR events) for visitors to its parks, resorts, and cruise ships that would further strengthen the feed-back loop to its merchandising, films, TV and cable network shows, videos, music, and books. New themed-exhibits, a major refurbishing of Disneyland Paris, and construction of three new cruise ships are coming on-line in the next couple of years.
Figure 1 and Table 1 below provide background to Disney’s reorganization and strategic positioning. While Media Networks contributes the bulk of Disney’s revenues and profits today, cable networks and TV broadcasters’ days are numbered in their existing form as cord-cutting intensifies. Hence, the formation of Direct-to-Consumer and International will initially supplement and likely subsume the Media Networks segment, and along with Parks, Experiences, and Consumer Products push Disney’s expansion abroad. Furthermore, the internet invaders, who all think big, are clearly focused on the global potential of entertainment and media as indicated in Chart 1. Studio Entertainment continues to drive The Most Magical Place On Earth with a broadened array of original entertainment and an extensive library archive. Through continuous development of branded and differentiated content, services, and consumer products Disney develops creative, innovative and profitable entertainment experiences and related products marketed through its network of physical and digital distribution channels. Mickey has thrown down his white gauntlet.
Figure 1: BCG Matrix.

Table 1: SWOT Analysis.

Chart 1: Percentage of Revenues from Outside the U.S.

Source: Company 10-Ks
Corporate Governance
Management and Stockholders
Leaders find it difficult to leave the Happiest Place On Earth. Originally set to retire in June 2018, CEO and Chairman Bob Iger had his employment contract extended four times, most recently to 2021, as the board deemed Iger indispensable once the 21 First Century Fox deal completes. The threats and challenges facing Disney are daunting and an experienced leader with strong industry knowledge and proven ability to successfully integrate acquisitions such as Iger would be indispensable. But, at what cost?
According to ISS Analytics, Iger’s total potential annual compensation would rise to $55 million, up from $36 million in 2017. A glance at Table 2 below shows that Iger’s proposed pay package would be double the industry average and median.
Members of Disney’s Board of Directors are elected annually at the company’s annual meeting. At present Disney has ten board members as one member passed away unexpectedly last year and three others did not stand for re-election at the most recent March 8 annual meeting. Again, given its history, Disney restricts the number of insiders on the board (Table 3).
Table 2: Entertainment and Media CEO Total Annual Compensation.
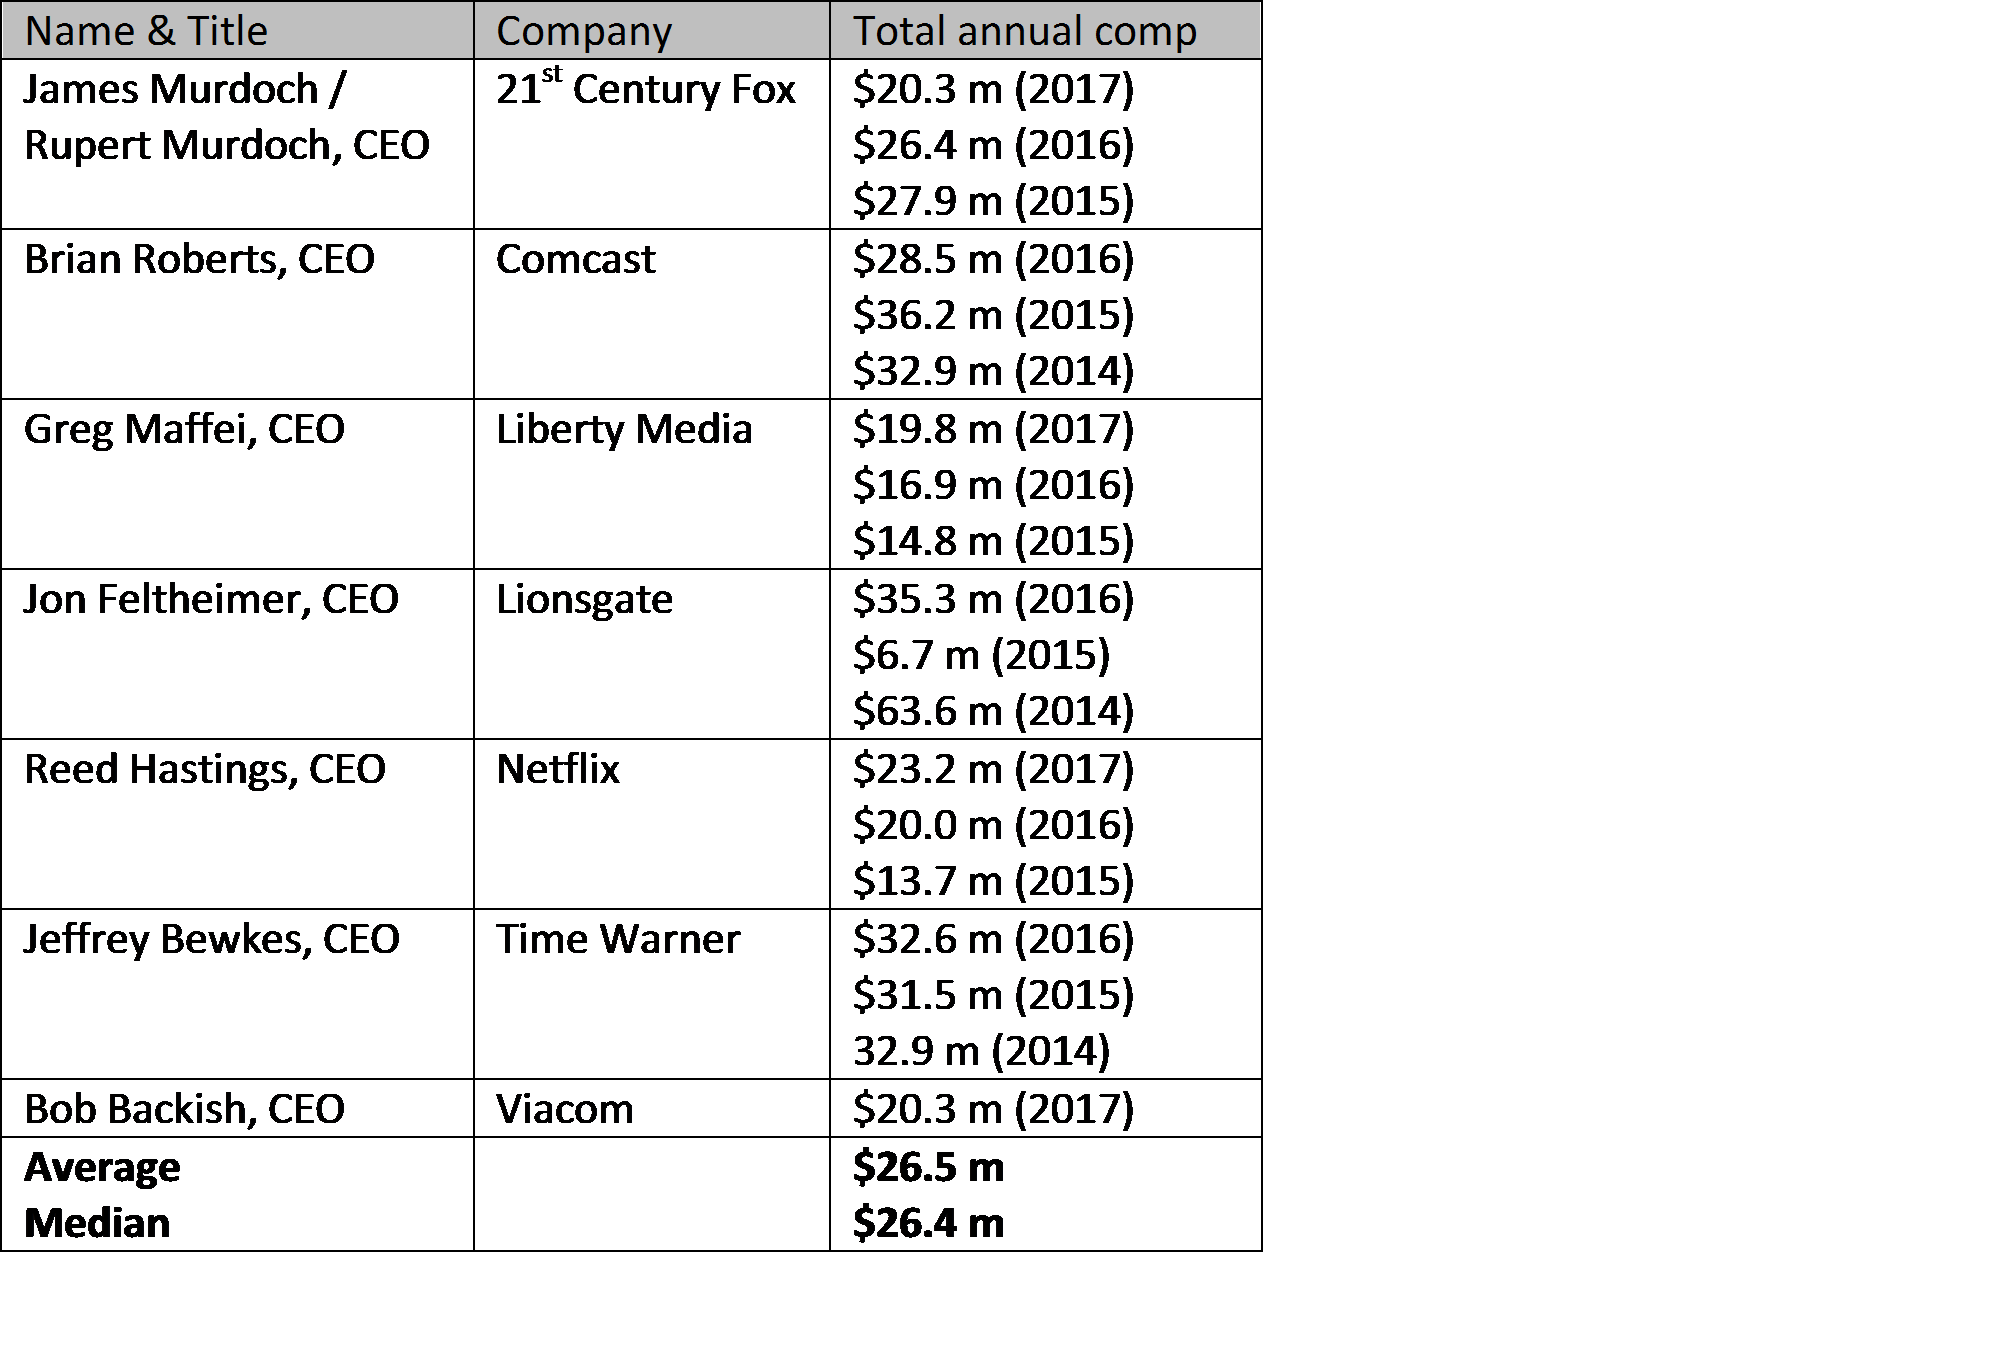
Table 3: Board of Directors.

Managerial Performance
Under Iger’s watch Disney has delivered tremendous value. Disney expanded its brand portfolio, international presence, revenues and profits, and currently prepares for a digital streaming world. Over the same period, total stockholder return jumped over 400% and Disney’s market capitalization rose from $46 billion to about $153 billion today. Importantly, Disney outperformed the competition (except Netflix) and overall market (Table 4 and Chart 2). But, an aggressive, new breed of competitors has entered the realm and the company lacks a clear succession plan – shareholders grow restless.
Table 4: Share Price Performance of U.S. Media Companies.
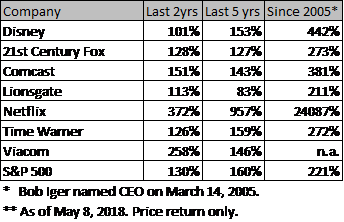
Chart 2: Disney’s Relative Share Price Performance (as of May 8, 2018)

Shareholder Composition
An examination of Disney’s shareholder composition shows that insiders hold just 0.13% of shares outstanding. The stock is widely held by institutional investors, representing 77%, with no single dominating stake. The marginal investor is an investment advisor. Fox and other entertainment and media firms display similar investor characteristics.
But, boring into the holdings of the new internet interlopers (FB, AAPL, AMZN, GOOGL) and Netflix reveals that growth-oriented investors hold a significantly larger stake than in Disney. Although Table 5 shows percentage holdings of growth style funds, the actual stake held by all growth-oriented investors would be much greater as funds such as ETF, Blended, and Asset Allocation do not break down investment styles. Nevertheless, should growth style funds shift into DIS to hold their average percentage holding (27%) that connotes a massive $24.5 billion transfer. Shifting shareholder composition shall require adroit management of expectations and signaling, including reinvestment and dividend and buyback policies. It’s time to crunch some numbers.
Table 5: Internet Company Growth Shareholdings vs Disney.

Value of Reorganization: Disney
Determining the value of Disney’s make-over starts with working out the equity value of Disney “As Is” (ValDisA). Then, the equity value of the reorganized Disney (ValDisB) is calculated, from which ValDisA is subtracted, giving the value of reorganization (ValReorg)( Figure 2). Let’s get started with the value of Disney “As Is.”
Figure 2: Calculating the Value of Reorganization.
![]()
Value of Disney “As Is”
The status-quo scenario represents Disney without the recently announced restructuring. More specifically, it constitutes Disney following the same investing, financing, and dividend and buyback policies as it has over the recent five years, or so. The media network business continues to deteriorate as cord-cutting amplifies, studio entertainment segment steadily produces box office hits that extends and strengthens its portfolio of brands, parks and resorts and consumer products operations generate healthy cash flow from the further monetizing of Disney’s brands, and the interactive franchise scrambles to compete in an internet-delivery world. The remainder of this section delves into the key drivers of Disney’s operations, culminating in a value for Disney “As Is.”
A three-stage discounted cash flow (DCF) model is employed consisting of a high growth phase for Year 1 to Year 5, transition phase for Year 6 to Year 10, and stable growth phase for Year 11 and after (table 6 and figure 3). Trailing twelve month (TTM) financials are used throughout this report, including Disney’s Second Quarter 2018 results (released May 8, 2018).
Despite the lower marginal corporate tax rate of 21.0%, U.S. companies will continue to employ tax-saving strategies to minimize their tax payable liability. For Disney, 15% to 20% indicates the likely range based on history; so, a 17.5% effective tax rate is set.
Last year’s return on capital (ROC) of 10.2% is used during the high growth phase, declining to 10% in Year 10 and stable thereafter. A reinvestment rate of 32.05%, last years’ rate, is used during the high growth phase, declining linearly to 25% by Year 10 and stable thereafter. All combined, the expected growth rate of 3.3% (10.2% ROC x 32.05% RR) during the high growth phase declines afterwards to the expected long-term U.S. GDP growth rate of 2.5% by Year 10, keeping steady onwards. Reinvestments have picked up over the last six months driving growth.
Since 2009, Disney focused on increasing its debt ratio to move toward its optimal capital structure via a combination of new debt issuance and stock buybacks, which helped boost equity valuation. The debt ratio currently stands at 34.16% and stays stable across all phases. Besides short-term and long-term borrowings, debt incorporates booked long-term pension liabilities and off-balance sheet commitments including non-recorded borrowings, capital leases, broadcast rights for sports, feature films and other programming, construction of three cruise ships, and creative talent and employment agreements, discounted at the firm’s cost of debt.
The Capital Asset Pricing model (CAPM) forms the framework for establishing a firm’s risk profile. Inputs for Disney’s cost of equity include 2.99% risk free rate (US treasury 10-year yield), 1.04 beta, and 5.46% equity risk premium (This analysis calculates a bottom-up beta as described in Appendix B: Bottom-Up Beta and an implied equity risk premium as described in Appendix C: Implied Equity Risk Premium). The Pride Lands’ cost of debt of 3.89% is based on the prevailing 10-year risk free rate (US Treasury 10-year yield) plus a default spread of 90 bps based on the company’s current A2/A+ credit rating. For the high growth phase, cost of equity stays at 8.69%, rising gradually from Year 6 to Year 10 to 9.36%, influenced by a slight decrease in the company’s beta as Disney matures further and a jump in its cost of debt to 4.80% due to rising interest-rate levels as implied by forward rates. Altogether, the cost of capital rests at 6.77% during the high growth phase and increases linearly to 7.46% by Year 10 into perpetuity.
With a current price of $101.79/share (at close on May 8, 2018), Disney’s shares are trading very rich relative to the equity value of Disney “As Is” of $85.79/share. However, Disney’s current share price reflects the pending takeover of Fox that could account for some of the difference. Free cash flows to firm (FCFF) over the high growth and transition phases contribute $73.4 billion, while FCFFs during the terminal phase provides $132.2 billion for a value of operating assets of $205.6 billion. Next, adding back cash and cash equivalents of $4.2 billion and non-operating assets of $3.1 billion, while subtracting debt of $79.7 billion, minority interests of $3.5 billion, and equity options worth $658 million gives an equity value of Disney “As Is” equity of $129.0 billion or $85.79/share.
For a copy of Disney’s 2017 financial statements and 2018 second quarter report, please refer to Appendix A: Disney’s Financials.
Table 6: Valuation Inputs to Disney “As Is”.

Figure 3: Valuation of Disney “As Is” (in USD millions).

Value of Disney “Reorganized”
The reorganized scenario depicts Disney assuming the successful implementation of the restructuring.
The reorganization of Disney rearranges the Magic Kingdom to compete in the rapidly changing entertainment and media space where technology morphs in to a core component of operations. The ability to collect and store big data from virtually all sources (both internal and external) and formats (visitor and customer data only represent a piece) and the ability to synthesize and analyze that data in real-time and deploy what has been learned throughout the organization in seconds is the next big thing. The newly captured knowledge unceasingly feeds back to propel disparate parts of operations ahead. To be sure, executing such a strategy across a large organization as Disney will be challenging as all areas need to be on-board. New processes, innovations, skills, and incentives need to be rolled-out with urgency – drawing on staffs’ inner-Dash couldn’t hurt. The right partner with established technologies and meaningful data points could jump-start this effort immensely, while simultaneously sending a clear message that Disney intends to dominate the 21st century (sorry, couldn’t resist). Naming a Chief Data Officer would at least show that Mickey gets it.
Regardless, superior entertainment and content production and marketing and distribution along with an ever-expanding brand portfolio still embody the primary drivers of success in the entertainment and media arena. Hence, creation of the Parks, Experiences and Consumer Products group makes sense and is in fine hands with leader Bob Chapek who has not only guided both Parks and Resorts and Consumer Products, but also previously steered distribution at The Walt Disney Studios, among other. Notwithstanding, the genesis of the Direct-to-Consumer and International (DCI) group demonstrates Disney’s focus on internet digital streaming and how it extends beyond U.S. soil. Naming of Kevin Mayer, who oversaw Disney’s active acquisition and divestiture efforts, to pilot the new division hints that takeovers and mergers may help launch this distribution locomotive. Moreover, the jewels of the Media Networks group could plausibly be hooked up to DCI with the rump sold-off. Lastly, but far from least, the Studio Entertainment arm shall be addressed in a forthcoming valuation of the Fox deal. A triumphant redirection of the House of Mouse by Iger and the rest of Disney’s senior management team would correspond to improved efficiency, greater productivity, elevated growth rates and, importantly, higher valuation. Let’s see how this narrative translates into numbers.
The equity value of Disney “Reorganized” of $129.19/share constitutes an undervaluation of 21.21%, or $41.2 billion in total from the current market price of $101.79/share. Improved efficiency and productivity pushes ROC up to 15%, while heavy reinvestment in tech-related research and development, internal capital expenditures, and acquisitions and operating investments propels the reinvestment rate to 50%. Expected growth in operating profits-before-interest-and-taxes, as a result, leaps to 7.5% during the high growth phase. As Disney matures by Year 10, ROC slides to 10% with reinvestment falling back slightly to 40%, but keeping pace with technology innovations and delivery systems is now mandatory for entertainment and media firms. Just to note, this implies a long-term growth rate of 4%, which is right around the long-term risk-free rate implied by forward rates. And, while higher than expected long-term US GDP growth rate forecasts, this analysis projects Disney to be a truly global media giant bringing Mickey Mouse, Iron Man, and future sagas of Star Wars to China, India, and all of Africa. The higher reinvestment rate may raise concern for some existing investors, particularly, those keen on maintaining dividend flow; but, The Happiest Place on Earth is expected to generate strong free cash flows to firm (FCFF) to safely cover its 1.65% dividend yield. Next, a look at the firm’s capital structure.
Disney’s optimal capital structure would likely be constrained by the desire to maintain an A to A- credit rating. This reorganized scenario bumps up the debt ratio to 37.50%, providing a probable rating of A2/A to A3/A- (with an interest rate coverage ratio of around 4.25). Interestingly, the optimal capital structure of about a 48.00% debt ratio maximizes Disney’s equity value at $195 billion, or $130/share, but carries a likely Baa2/BBB rating that would probably cause the board to cry wolf or the Hulk to go on a rampage. For a detailed discussion on moving to the optimal capital structure, please refer to Appendix D: Optimal Capital Structure.
A downshift in Media Networks combined with an upshift in Direct-to-Consumer and International plus higher reinvesting and additional leverage bounces the beta all the way to 1.43 which raises the cost of equity to 10.78% and cost of capital to 7.96% in the high growth phase. But, beta, cost of equity, and cost of capital drop to 1.00, 9.36%, and 7.34%, respectively, as maturity sets and the cash machine kicks in after Year 10. FCFF over the high growth and transition phases contribute $64.4 billion, while FCFFs during the terminal phase provides $205.4 billion for a value of operating assets of $269.8 billion. Next, adding back cash and cash equivalents of $4.2 billion and non-operating assets of $3.1 billion, while subtracting debt of $78.7 billion, minority interests of $3.5 billion, and equity options worth $658 million gives an equity value of Disney “Reorganized” of $194.3 billion, or $129.19/share.
Table 7: Valuation Inputs to Disney “Reorganized”.

Figure 4: Valuation of Disney “Reorganized” (in USD millions).

Value of Reorganization
Disney’s value of reorganization works out to $43.40/share or $65.3 billion (figure 5). This value represents the long-term value added by successfully implementing the company’s reorganization plan, staying focused on its mission, and executing its business model and strategies going-forward.
Figure 5: Calculating the Value of Reorganization.

Conclusion
This report presents a detailed composition of the valuation of The Walt Disney Company with the goal of attempting to show the impact of the announced reorganization. Disney offers a unique opportunity to demonstrate this because it operates in the media and entertainment industry that is undergoing dramatic change. For those companies that can integrate the new technologies and innovations while remaining focused on consistently delivering creative, inspirational and profitable entertainment experiences will achieve success for generations to come. Like a Hollywood movie, the media sector provides a venue to watch how established-actors take-up the challenge to adapt and thrive in a mercurial and highly competitive environment. As an equity research analyst, this makes it meaningful, and even fun, to determine the fundamental value that is created, or destroyed, as firms pick-up the gauntlet.
This analysis applied a comprehensive DCF model to ascertain the value of Disney’s on-going restructuring. By focusing on the key drivers of growth – return on capital and reinvestment rate – and closely scrutinizing and fine-tuning the capital structure and cost of capital of the House of Mouse, the model yielded $65.3 billion of created value, or an additional $43.40/share. The reorganized Disney has an estimated equity value of $194.3 billion and a projected firm value of $277.1 billion, providing an upside of 26.9% from the May 8, 2018 closing price of $101.79/share.
This analyst predicts that the Happiest Place on Earth will be even happier in the decades ahead.
Appendix A: Disney’s Financials
[omit]
Appendix B: Bottom-Up Beta
Calculation of Bottom-Up Beta
This report utilizes a bottom-up beta approach in calculating the beta of a firm. This author prefers a bottom-up beta for companies and sectors undergoing significant change that might impact investing, financing, or dividend and buyback policy, which affects the riskiness of the business. A regression beta against the stock of the firm would have more difficulty capturing developing risk, especially if the risk emanates from a specific business segment, plus the standard error of beta for a single stock is notoriously high.
The bottom-up beta method calculates a beta for each business segment of the firm by examining the individual company betas (2-year regression) within a given sector along with the sector’s median beta, debt-to-equity ratio, marginal tax-rate, cash-to-firm value, and enterprise value-to-sales ratio. Then, each (levered) beta is unlevered using the formula in Figure B1 to arrive at a business unlevered beta for each sector. Note that the standard error of beta for a sector will be dramatically lower than that of a single firm beta.
Figure B1.
![]()
Next, the effect of cash needs to be removed from the unlevered beta because a subsequent step makes use of the enterprise value-to-sales ratio, which excludes cash. The formula in Figure B2 does just that, producing a pure play (unlevered) beta for the sector.
Figure B2.
![]()
Continuing, the pure play beta of the sector needs to be levered up to reflect the debt-to-equity level of each business segment in the firm. But, what if the company doesn’t report this? To improvise, for each division gather revenues and identifiable assets; also, get the total market value of debt of the firm (including off-balance sheet commitments, such as capital leases) and the market capitalization of the firm. First, calculate the proportion of debt of each business segment by allocating the company’s total debt to its divisions by weighted-identifiable assets. Second, calculate the equity value of each business segment by allocating the company’s market capitalization by weighted-revenues. Dividing the first number by the second gives the debt-to-equity ratio of each business segment. Then, reconfiguring the formula in Figure B1, apply the formula in Figure B3 to get the levered beta of each division.
Figure B3.
![]()
Finally, multiply the levered beta for each division by the division’s proportion of total revenue and sum to arrive at the beta of the firm.
Appendix C: Implied Equity Risk Premium
Calculation of Implied Equity Risk Premium
This report uses the implied equity risk premium (ERP) approach to determine the average equity risk premium above the risk free rate for a given market. The primary advantages of implied ERP over other methods (geometric average of stock market returns above risk free rate, regression, IBBOTSON) is that it is a forward-looking indicator and can be employed in markets (developing markets in particular) where sufficient data is unavailable.
The overall steps are to calculate the implied ERP for a mature market (S&P 500 for the US in this case), determine an appropriate country risk premium for “riskier” markets, and adjust for equity-bond volatility (multiply by Equity annualized std.dev. / Debt annualized std.dev.) difference to arrive at the country implied ERP. So, if the implied ERP of the US is determined to be 5.08%, other mature markets of equal ranking (AA+ to AAA/Aaa) would have the same ERP. But, the UK with an AA/Aa2 credit rating actually has a country risk spread that after volatility adjustment yields an ERP of 5.65%. To be sure, implied ERPs do change continuously.
To obtain an implied ERP for a region, just take the market capitalization-weighted average of the country ERPs within the region and sum. Once country and regional ERPs are calculated, implied ERPs can be calculated at the firm level. To do this, take the company’s revenue-by-geographic region weighted average of the regional or country ERPs and add. Next, a look at the mechanics.
Using a dividend discount model (DDM) on an entire stock market (stock market index), the expected return of investors can be worked-out and from that an implied ERP. While there are many flavors of DDM, this analysis uses a simple two-stage DDM, where dividends and buybacks are projected over a five-year period, after which dividends and buybacks are assumed to grow at the lower of the risk free rate and consensus GDP growth rate of the country. The inputs to the model include current price of the stock market index, TTM dividends and buybacks for the index, top down analyst estimate of earnings growth (thus, dividends and buybacks are assumed to grow at a similar rate) for index with stable payout, and long-term risk free rate (UST 10-year yield for US). While bottom-up sell-side analyst estimates tend to be legendarily upwardly biased, top down estimates generally have a more favorable acceptance. So, plugging the inputs in the formula in figure C1 and solving for r, gives the expected return of investors. Next, it’s simply a matter of subtracting the risk free rate to get the implied ERP.
Figure C1.

Appendix D: Optimal Capital Structure of Disney
Determining Disney’s Optimal Capital Structure
The ability to alter the composition of the financing mix enables firms to minimize the cost of capital. Over the past two decades Disney has gradually lifted its debt ratio from around 19% through a combination of new debt issuance and stock buybacks, to drive its cost of capital down contributing to its stellar share price performance. For reorganized Disney, the debt ratio is set at 37.5% giving a cost of capital of 7.96% during the high growth phase, declining to 7.34% by Year 10 and thereafter; this corresponds to an equity valuation of $194.3 billion. The remainder of this section analyzes reorganized Disney’s capital structure and discusses a method for moving towards its optimal level.
Cost of Capital
Let’s first examine the cost of equity. Disney’s unlevered beta of 0.97 was calculated using the bottom-up beta approach (Appendix B: Bottom-Up Beta). Using the Beta formula in Figure D1, increasing the proportion of debt raises the beta. The effect of a rising beta is greater sensitivity of equity to the overall market as shown in the cost of equity formula in Figure D1. Repeating these sets of calculations for increasing levels of debt yields the results under the Cost of Equity section in Table D1.
As Disney’s proportion of debt rises so does interest expense, reducing the interest coverage ratio and decreasing the credit worthiness of the company. As highlighted by the bond ratings in Table D1, the move from investment grade to junk is swift. When the adjusted marginal tax rate falls below 21%, the company’s net interest expense exceeds EBIT (tax benefits only apply to profits). While Disney currently holds an A2/A+ rating from Moody’s/S&P, for the purpose of creating a cost of capital schedule, this report applies a synthetic rating based on the firm’s interest rate coverage ratio relative to a universe of rated bonds to facilitate the analysis; thus, at the 37.5% debt ratio level, Disney is assigned a synthetic rating of A3/A- and a 113 bps default spread (for data source pleases, refer to Appendix E: Acknowledgement). This accounts for the difference between the calculated equity value of Disney in this optimal capital structure section and from that in the main body of the report.
Optimal Capital Structure
Disney currently maintains a 34.16% debt ratio as discussed in the Value of Disney “As Is” section. As part of Disney’s reorganization this analysis considers a possible move towards Disney’s optimal capital structure. Continuing with the cost of capital approach that this analysis has used, there are two choices:
1. Single Variable Analysis: Keep firm value fixed by assuming pre-tax operating profits are unaffected by the financing mix and adjust the cost of capital to arrive at the optimal capital structure.
2. Two Variable Analysis: Allow both firm value and cost of capital to vary to obtain the optimal capital structure.
For obvious reasons, the second approach is inherently more challenging as pre-tax operating profits would be permitted to vary so that firm value can be recalculated at each debt ratio level (0% to 95% in 5% increments) and the cost of capital would be varied across a range of values within each debt ratio level and a new credit spread/bond rating would need to be determined at each node to recalculate the cost of debt, cost of equity, cost of capital, beta, and interest expense. While the first approach will be followed, the punchline is that in the second approach the minimal cost of capital does not necessarily correspond with the highest equity valuation of the company. Let’s get started with the first approach.
Optimal Capital Structure: Single Variable Analysis
As suggested, the single variable optimal capital structure approach leads to a minimized cost of capital that produces the maximized equity valuation for a firm. To accomplish this, it requires the assumption that operating profits and cash flows are not affected by the capital structure. For relatively minor shifts, this is entirely plausible. So, for a given firm value (market capitalization plus market value of debt) and debt level the amount of interest expense and matching interest coverage ratio is computed to determine a synthetic bond rating and appropriate default spread. Other financial ratios and more sophisticated methods are available to determine default spreads, but that level of precision is not necessary as only an approximation is required here. As a firm’s cost of debt shifts, a chain of events are set in motion: The beta needs to be adjusted as described earlier; the cost of equity and the cost of capital changes across the high growth, transition, and stable periods; and, of course, the discounting of cash flows from operating profits need to be discounted at the new cost of capital that ultimately delivers a revised valuation of equity. Sounds relatively simple and straightforward, but the mechanics can be tricky.
Because of circular logic inherent in the calculation of the cost of debt, interest expense, and interest coverage ratio it is necessary to perform two iterations. For a given debt ratio level, a guess at the bond rating and an associative default spread is made to calculate the interest expense. This first attempt often results in an interest expense that calls for a different bond rating and default spread. So, a second pass is made using the new, synthetically-derived credit spread to produce different costs of debt across debt ratio levels, thus the actions described above can occur. Table D2 provides a snapshot of an optimal capital structure analysis for reorganized Disney using all of the criteria described in the Value of Disney “Reorganized” section.
As shown, the 45% to 50% debt ratio level minimizes the cost of capital and produces the highest value of equity for Disney. But, too close for comfort to the non-investment grade band (below Baa3/BBB-) for the Magic Kingdom and notice how lower B levels come quickly thereafter. The strategy suggested by this author is probably the better of course of action: 37.5% debt ratio level for a A2/A to A3/A- bond rating and 90 bps to 113 bps default spread. A more aggressive action offers only a slight pick-up in value and the risk of angering the Hulk.
Figure D1.

Table D1. Optimal Capital Structure Analysis: Disney “Reorganized”.

Table D2. Cost of Capital Schedule: Disney “Reorganized” (Firm Value = $277,144m @ 37.5% debt ratio)($ millions).

Table D2. Cost of Capital Schedule: Disney “Reorganized” (Firm Value = $277,144m @ 37.5% debt ratio)($ millions).

Appendix E: Acknowledgement
Thank You
The author would like to thank the kind generosity and absolute dedication of Professor Aswath Damodaran, who teaches corporate finance and equity valuation at the Stern School of Business at New York University.
The sector betas, implied equity risk premiums across geographical regions and countries, company debt default spread calculator, and equity option pricing calculator were provided by Prof. Damodaran through his NYU Stern website. Also, several of the diagrams used to present a summarized view of a firm’s valuation are based on diagrams created by Prof. Damodaran. The discounted cash flow and dividend discount equity valuation models used in this report are based on models that Prof. Damodaran used when the author attended Stern. Similar models are available on Prof. Damodaran’s website.
Of course, all errors and omissions contained in this report are strictly the responsibility of the author.
————————————————————————————————————-
Sources
Data
Bloomberg Terminal
FRED Economic Data
Google Search
Investing.com
Macrotrends.net
Prof. Aswath Damodaran, NYU Stern Website, Data
S&P Capital IQ
Yahoo! Financial
Company Reports
21st Century Fox 2017 Annual Report/10-K, Q1 2018 10-Q
Alphabet Annual 2017 Annual Report/10-K, Q1 2018 10-Q
Amazon Annual 2017 Annual Report/10-K
Apple Annual 2017 Annual Report/10-K, Q1 2018 10-Q, Q2 2018 10-Q
Baidu 2017 Report/20-F
Bertelsmann 2017 Annual Report
Comcast 2017 Annual Report/10-K, Q1 2018 10-Q, Q2 2018 10-Q
Facebook Annual 2017 Annual Report/10-K, Q1 2018 10-Q
Lionsgate 2017 Annual Report/10-K, Q1 2018 10-Q, Q2 2018 10-Q, Q3 2018 10-Q
Microsoft Annual Report/10-K, Q1 2018 10-Q, Q2 2018 10-Q, Q3 2018 10-Q
Netflix Annual 2017 Annual Report/10-K, Q1 2018 10-Q
Sky 2017 Annual Report/H1 2018 Report
Sony 2016 20-F, Q1 2017 Quarterly Financials
Tencent 2017 Annual Report
Time Warner 2017 Annual Report/10-K, Q1 2018 10-Q
Viacom 2017 Annual Report/10-K, Q1 2018 10-Q
The Walt Disney Company: 2017 and 2016 Annual Report/10-K, Q2 2017 10-Q, Q2 2018 10-Q
Wanda Group Corporate Website

You must be logged in to post a comment.